

Jul. 8th, 2026 Option Outlook
Tech Rotation and overnight missiles

Good Morning! A rotation out of tech caused a -.45% retrace in SPX.
It seems like the memory rally is beginning to show signs of fading after a 9% decline in Samsung shares after record breaking earnings. Meanwhile, in one of the least surprising developments in the US-Iran peace talks, the MoU turned into an MoM (Memorandum of Misunderstanding) with Iran and the US having different ideas of what “management of the Strait of Hormuz” entailed. It has caused an initial downturn in the pre-market, but I expect a rebound since that seems to be the strategy of the market whenever there are US and Iran strikes.
Do we see anything in the options?
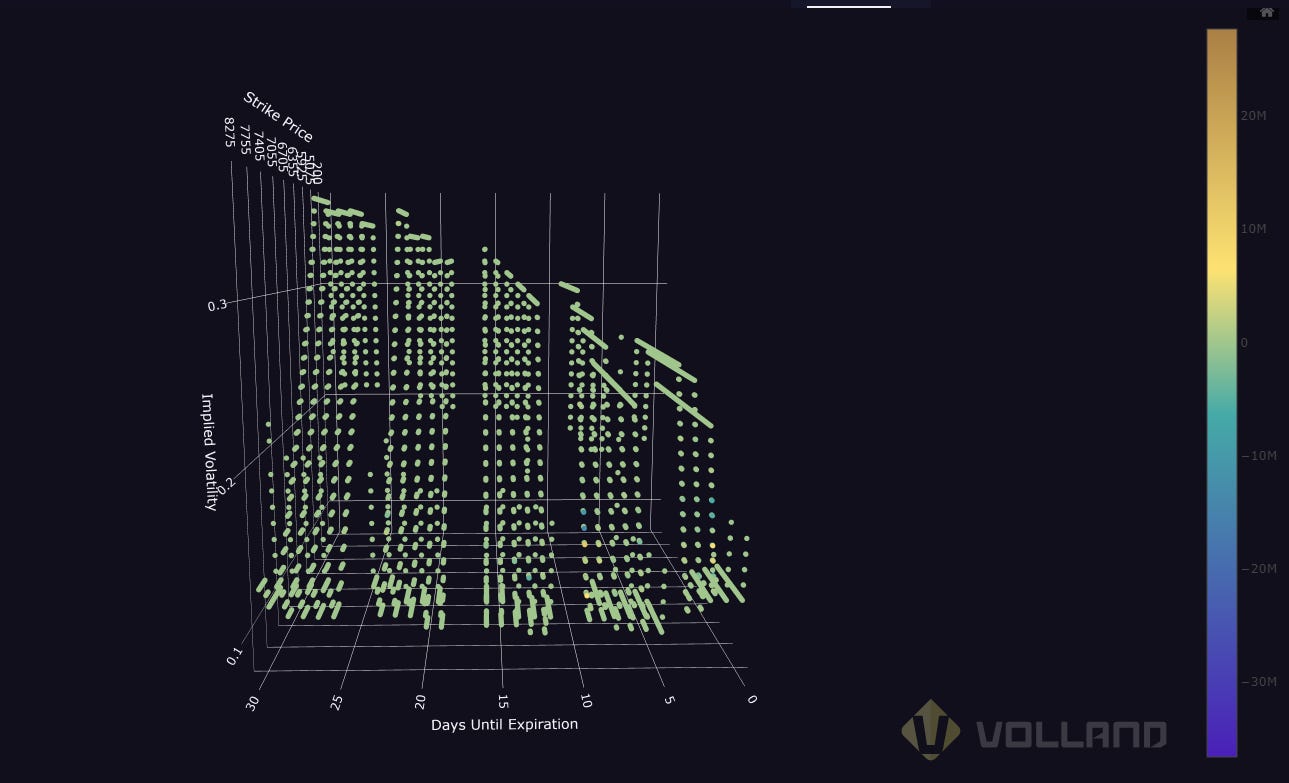
This is our 3D vol plane. Each dot represents the fixed price vol of that individual option. As displayed, the x axis is DTE, the y axis is implied volatility, and the z-axis is strike. Many of the dots have a yellow color, but some are blue or orange. That heatmap is showing the exposure of the option to whatever greek is chosen. In this case it is gamma, but that’s not what I’m stressing right now.
This 3D vol chart can be rotated, and right now I have it rotated to look at the SPX term structure. As is the norm, the lowest vol is 3-5DTE with the steepest vol at 0DTE, but there are a few knots in the vol curve. In particular, there is a little vol pop in the 22DTE area. This area would represent the FOMC meeting at the end of July. One of my favorite moves is to sell options before the meeting and buy after, creating a double calendar. The bounds haven’t changed since Monday (7350-7600), so now is the time to execute this strategy if you want to take advantage of the disparity of IV between those strikes.